
The best indicator of the markets tells us that a stock crash is near
We live in the information age and this is reflected in the amount of data we have on a daily basis. This is causing that on many occasions we lose focus of what is really important and very complex estimates are made with high overfitting.
It has been shown that the more complex a system is, the worse its performance tends to be and that it is often much simpler to use a single ratio and leave aside the noise of the markets, as we show in the following article
One of the most famous indicators that best reflects market sentiment has historically been the ‘Fear & Greed Index’ published by CNN and updated daily. This indicator gives an estimate of how the market is doing in a value between 0–100. With 0 being an absolute fear on the part of investors.
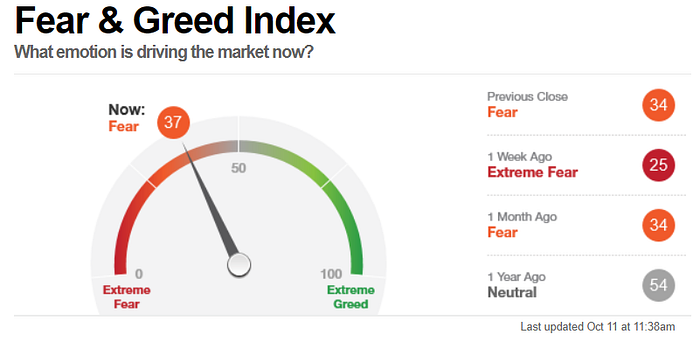
Although this may appear to be a simple indicator of investor sentiment, it is composed of the average of 7 other indicators: Junk Bond Demand, Market Volatility, Safe Haven Demand, Stock Price Breadth, Put and Call Options, Market Momentum and Stock Price Strength.
Keep It Simple St***D
One of the most profitable investment strategies over time has been to position against the behavior of most investors. This positioning generally does not work in the short term, as there is a very important momentum component, but it tends to give brilliant results in the long term.
The metric that best indicates the positioning of the market has been the debt margin, and historically the following cycle occurs, in which investors tend to take on considerable debt during the Exuberance Euphoria and Anxiety phases.

To see where we are in the cycle, just look at the chart below. It shows how the index has doubled in value since the pandemic and has seen one of the biggest rallies in history. the year-on-year increase in the S&P 500 (the main stock index in the United States) to the end of June almost equalling the highest ever year-on-year move seen in 50 years.
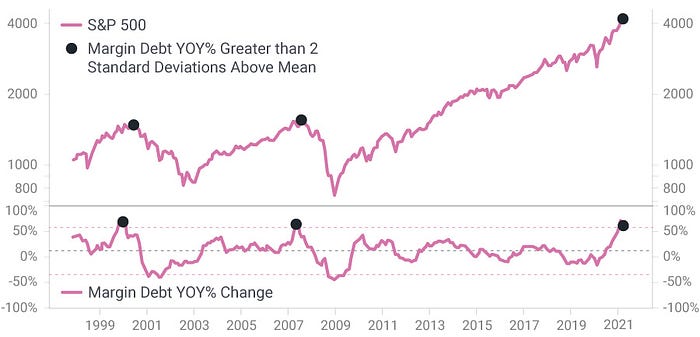
You know the expression that ‘what goes up fast, goes down faster’ and if we add to this that, as shown at the bottom of the image above, we are at +50% YoY Margin Debt Change it seems clear that the end of the cycle is just around the corner. These Margin Debt growths had only been recorded during the 2000 and 2008 crises where the market declined +40%.
We are facing a unique moment in the market; never before have we been so indebted and never before has the world been so highly globalized. This will mean that the day there is a crash, all assets and all markets will tend to correlate and the fall will be magnified. In order to avoid this possible fall and even benefit exponentially from it, it can only be done by means of an asymmetric portfolio.
This portfolio benefits from all market situations and with an exposure of only 40–60% of the entire portfolio. In Asymmetric Finance the portfolio and all its movements are shared in detail. This portfolio aims to benefit from the asymmetric distributions of the markets. If you want to know more, feel free to subscribe.
WHERE TO CONTACT US
Website : https://forextrade1.co/
Twitter : www.twitter.com/forextrade11
Telegram : telegram.me/ftrade1
Facebook : www.facebook.com/Forextrade01
Instagram : www.instagram.com/forextrade1
YouTube : www.youtube.com/ForexTrade1
Skype : forextrade01@outlook.com
Email ID : info@forextrade1.com
Discord : https://discord.gg/vEk98ZvrHP